Notice: Function _load_textdomain_just_in_time was called incorrectly. Translation loading for the astra-sites domain was triggered too early. This is usually an indicator for some code in the plugin or theme running too early. Translations should be loaded at the init action or later. Please see Debugging in WordPress for more information. (This message was added in version 6.7.0.) in /home/statplace/public_html/site/wp-includes/functions.php on line 6114

Notice: Function _load_textdomain_just_in_time was called incorrectly. Translation loading for the jetpack domain was triggered too early. This is usually an indicator for some code in the plugin or theme running too early. Translations should be loaded at the init action or later. Please see Debugging in WordPress for more information. (This message was added in version 6.7.0.) in /home/statplace/public_html/site/wp-includes/functions.php on line 6114

Notice: Function _load_textdomain_just_in_time was called incorrectly. Translation loading for the wpforms-lite domain was triggered too early. This is usually an indicator for some code in the plugin or theme running too early. Translations should be loaded at the init action or later. Please see Debugging in WordPress for more information. (This message was added in version 6.7.0.) in /home/statplace/public_html/site/wp-includes/functions.php on line 6114

Notice: Function _load_textdomain_just_in_time was called incorrectly. Translation loading for the wordpress-seo domain was triggered too early. This is usually an indicator for some code in the plugin or theme running too early. Translations should be loaded at the init action or later. Please see Debugging in WordPress for more information. (This message was added in version 6.7.0.) in /home/statplace/public_html/site/wp-includes/functions.php on line 6114

Notice: A função _load_textdomain_just_in_time foi chamada incorretamente. O carregamento da tradução para o domínio astra foi ativado muito cedo. Isso geralmente é um indicador de que algum código no plugin ou tema está sendo executado muito cedo. As traduções devem ser carregadas na ação init ou mais tarde. Leia como Depurar o WordPress para mais informações. (Esta mensagem foi adicionada na versão 6.7.0.) in /home/statplace/public_html/site/wp-includes/functions.php on line 6114
Pacote Highcharter no R - Statplace
artigoshighcharter-16

Pacote Highcharter no R

Aprenda a usar o pacote Highcharter no R para criar gráficos interativos com a biblioteca Highcharts de forma simples e eficiente.
Artigo escrito com a colaboração de Isabela Regina Aguilar

O pacote highcharter no R realiza uma tarefa fundamental em qualquer análise de dados: a visualização. Ele é um pacote para a biblioteca Highcharts em JavaScript e oferece uma série de funções com a finalidade de facilitar a produção de gráficos e objetos dentro do R.

Para que possa utilizá-lo é necessário instalar o pacote Highcharter:

install.packages("highcharter")

funções Hchart() e Highchart()

As funções hchart() e highchart() são responsáveis pela construção desses objetos no R. Eles são construídos em camadas, o que facilita o entendimento de seu funcionamento por meio de pequenos exemplos. O operador pipe %>% pode ser utilizado para conectar as funções do Highcharter, uma vez que cada função gerará uma nova camada, isso significa que cada função depende do resultado obtido pela anterior, o que justifica o uso desse operador para facilitar a construção dos gráficos.

head(citytemp)
## # A tibble: 6 x 5
##   month tokyo new_york berlin london
##   <chr> <dbl>    <dbl>  <dbl>  <dbl>
## 1 Jan     7       -0.2   -0.9    3.9
## 2 Feb     6.9      0.8    0.6    4.2
## 3 Mar     9.5      5.7    3.5    5.7
## 4 Apr    14.5     11.3    8.4    8.5
## 5 May    18.2     17     13.5   11.9
## 6 Jun    21.5     22     17     15.2
hchart(citytemp,'column', hcaes(x = month, y = new_york))
highcharter city temp gráfico de colunas

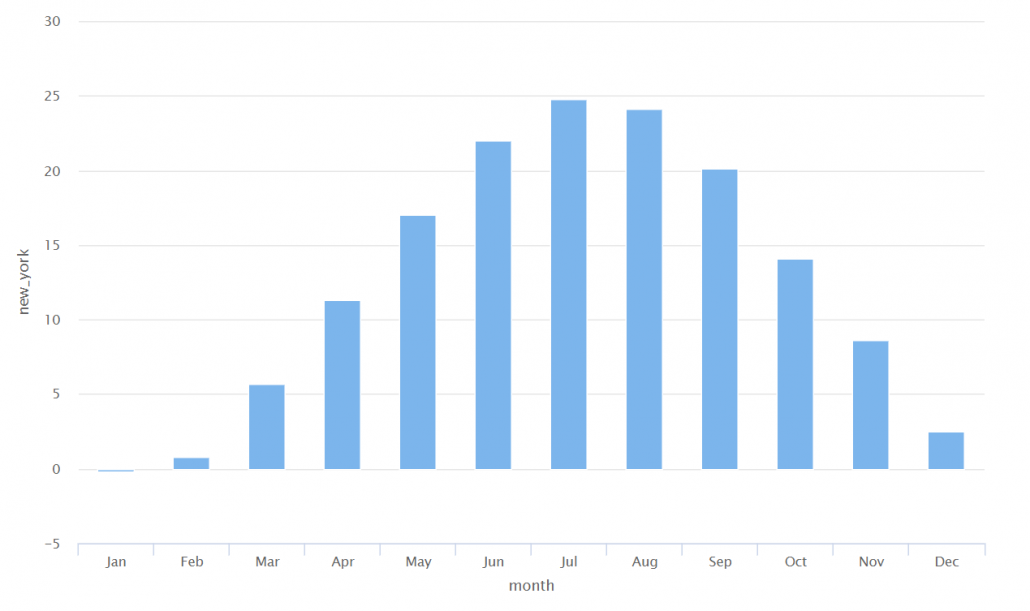
De JavaScript para o R

Para “traduzir” gráficos escritos em JavaScript para o R basta adicionar hc_ antes de cada função, substituir :{} por () e [] por c()

Exemplos do pacote highcharter

Gráfico de linha

hchart(citytemp,'line', hcaes(x=citytemp$month, y=citytemp$new_york)) %>% 
  hc_title(text = "Gráfico sobre a variação mensal de temperatura em Nova York") %>% 
  hc_xAxis(title= list(text= "Meses do ano ")) %>%
  hc_yAxis(title= list(text="Variação de Temperatura ")) %>% 
  hc_add_theme(hc_theme_darkunica())
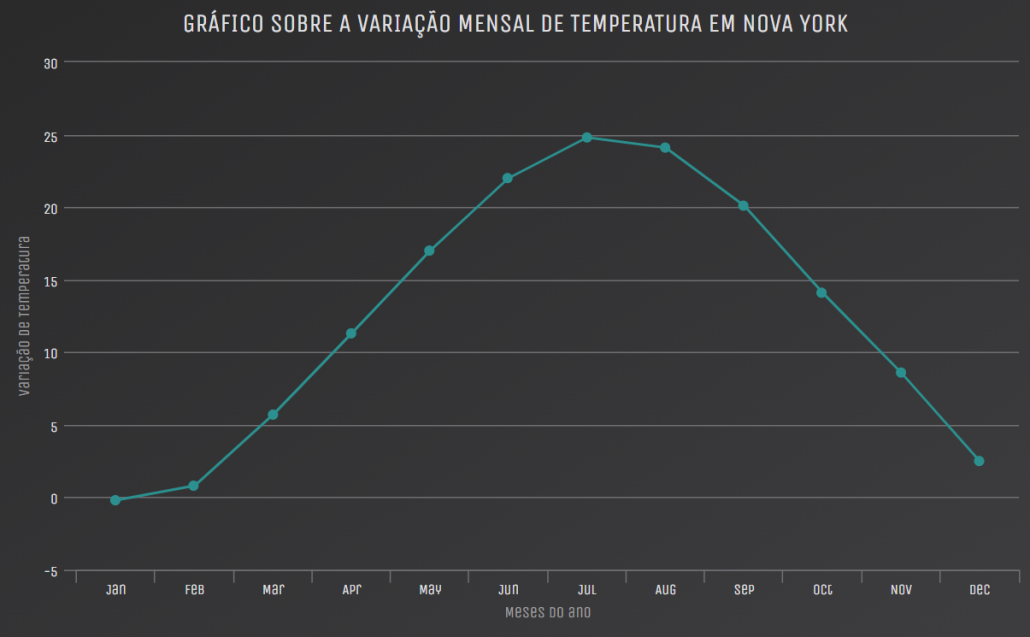
highcharter city temp gráfico de linha

Gráfico de área

head(WorldPhones)
##   N.Amer Europe Asia S.Amer Oceania Africa Mid.Amer Anos
## 1  45939  21574 2876   1815    1646     89      555 1951
## 2  60423  29990 4708   2568    2366   1411      733 1956
## 3  64721  32510 5230   2695    2526   1546      773 1957
## 4  68484  35218 6662   2845    2691   1663      836 1958
## 5  71799  37598 6856   3000    2868   1769      911 1959
## 6  76036  40341 8220   3145    3054   1905     1008 1960
hchart(WorldPhones,'area', hcaes(x=Anos, y=WorldPhones$S.Amer)) %>% 
  hc_title(text = "Gráfico sobre o aumento do número de telefones na América do Sul") %>% 
  hc_xAxis(title= list(text= "Anos")) %>%
  hc_yAxis(title= list(text="Quantidade de Telefones ")) %>% 
  hc_tooltip(pointFormat = "Telefones: {point.y}") %>% 
  hc_colors(colors = "green")
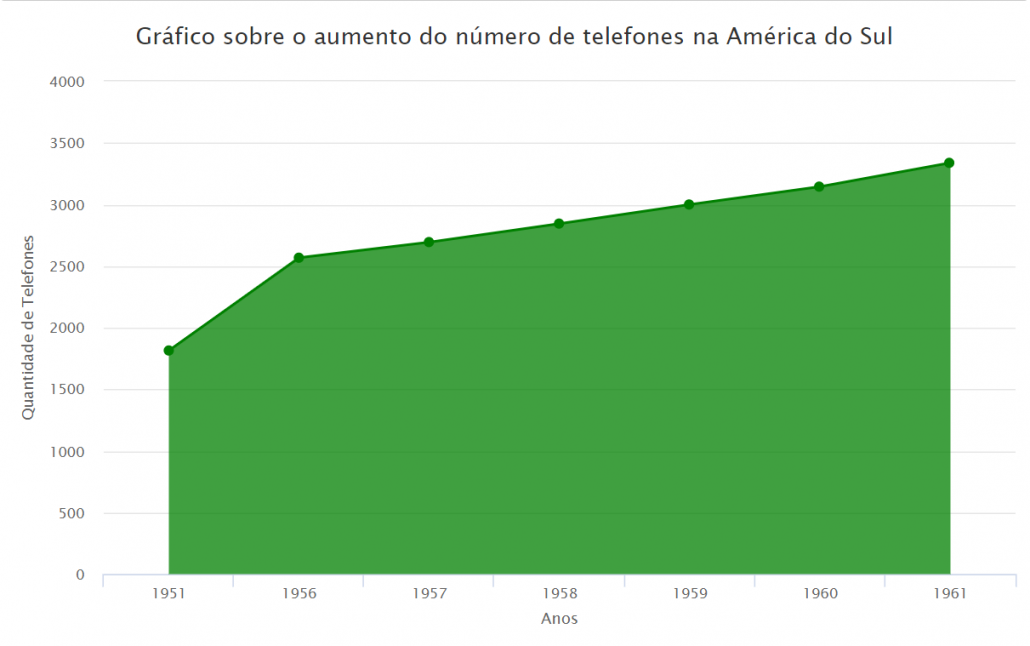
highchart telefones da américa do sul gráfico de área

Mapas

Usamos a função hcmap() para traçar um mapa a partir de dados de mapas disponíveis na biblioteca Highcharts.

hcmap(map = "countries/br/br-all", showInLegend= FALSE) %>%
  hc_title(text = "Mapa do Brasil")
highcharter mapa do brasil
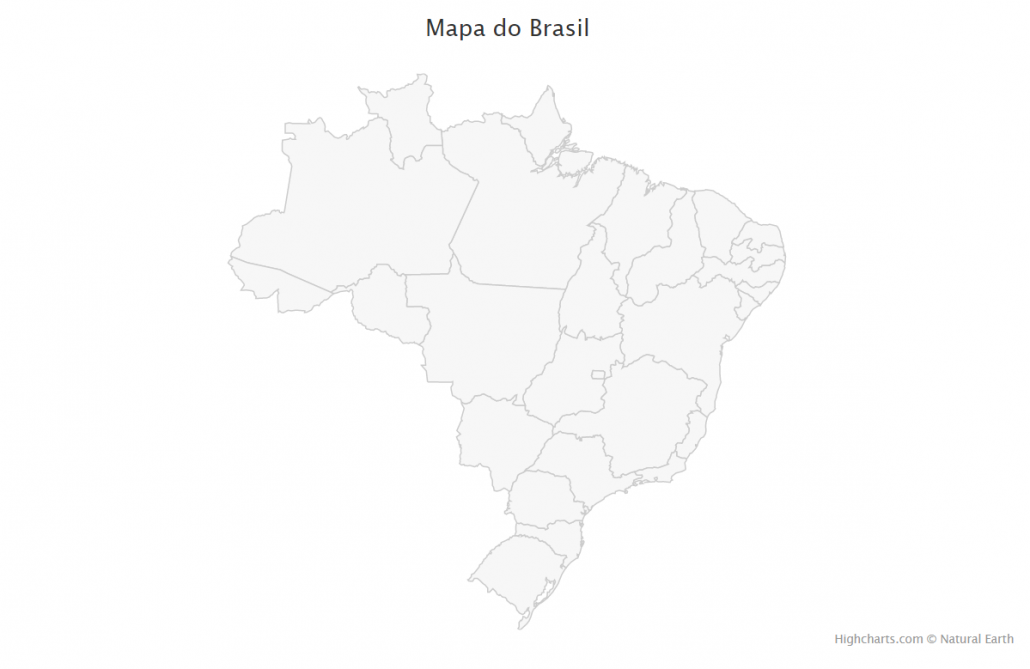
hcmap("countries/br/br-all", data = dados_ficticios, value = "value",
      joinBy = c("hc-a2", "code"), name= "Valor",
      dataLabels = list(enabled = TRUE, format = '{point.code}')) %>%
  hc_title(text = "Brasil") 
highcharter mapa do brasil estados

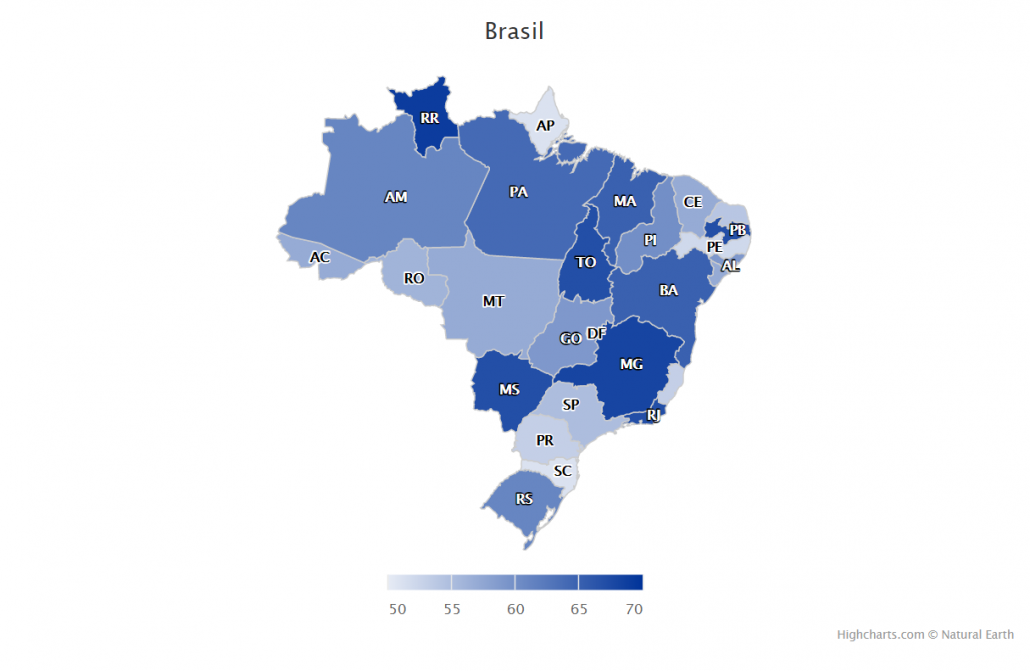
Highcharter no Shiny

Para exibição desses gráficos no Shiny basta utilizar duas funções highchartOutput e renderHighchart

Gostou do nosso conteúdo e quer mais dicas sobre o R? Siga-nos nas redes sociais! Estamos no Instagram, Facebook e LinkedIn, avisamos por lá sempre que tiverem artigos novos.

Share the Post:
Compartilhar no facebook
Compartilhar no twitter
Compartilhar no linkedin

Deixe um comentário

O seu endereço de e-mail não será publicado. Campos obrigatórios são marcados com *

Related Posts